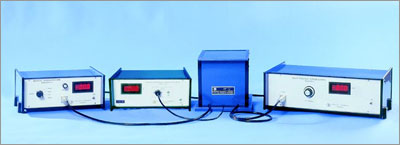
> DDS Function Signal Generator
> Digital Multimeters
> Distortion Analyzer
> Four Probe experiment
> Function Generator
> IC Testers
> LCR Meters
> Oscilloscopes
> Power Supplies
> Pulse Wave Frequency Meter
> Signal / Function Generator
> Storage Oscilloscopes
> Two Probe Setup
> Withstand Tester
> General Physics Equipments
 
- Digital Micro Volt Meter
- Digital Nano Ammeter
- Digital Pico Ammeter
- Digital Gaussmeter
- Magnetic Field Measurement Apparatus
- Study of Dieletric Constant & Curie Temp of Ferroelectric Ceramics
- e/m Experiment
- Planck’s Constant by Photoelectric Effect
- Determination of Planck’s Constant by means of LED’s
- Frank Hertz Experiment
- Ionisation Potential Set-up
- Measurement of Magnetoresistance of Semiconductors
- Two Probe Method for Resistivity Measurement of Insulators
- Electron Spin Resonance Spectrometer
- Study of Thermoluminescence of F-centres in Alkali Halide Crystals
- Hall Effect in Metals
- Dependence of Hall Coefficient on Temperature
- Apparatus for the Measurement of Susceptibility of Paramagnetic Solution by Quinck's Tube Method
- Apparatus for the Measurement of Susceptibility of Solids by Gouy’s Method
- Magnetic Hysteresis Loop Tracer
   
> TEKON INSTRUMENTS
  - T100 Network Cable Detector
  - T550 Power Quality Analyzer
  - T560 Power Quality Analyzer
  - T600 Txr Turn to Ration
  - T610 Txr Analyzer
  - T650 ESS Diagnostic
  - T700 Ind. Robot Diagnostic
  - T800 EV-HEV Diagonstic


General Physics Equipments

Study of Thermoluminescence of F-centers in Alkali Halide Crystals


Pure alkali halide crystals are transparent throughout the visible region of the spectrum. The crystals may be colored in a number of ways

(1) by the introduction of chemical impurities
(2) by introducing an excess of the metal ion
(3) by X-ray, g-ray, neutron and electron bombardment
(4) by electrolysis

A colour centre is a lattice defect that absorbs visible light. The simplest colour center is an F-centre. The name comes from the German word for colour, Forbs. We usually produce F-centres by heating the crystal in excess alkali vapours or by irradiation. The new crystals show an absorption band in the visible or ultraviolet, whereas the original crystals are transparent in that region. This absorption band is called F-band.

An F-centre can be regarded as a negative ion vacancy and an electron which is equally shared by the positive ions, surrounding the vacant lattice site. Conversely a hole may be trapped at a +ve ion vacancy or at a -ve ion, giving rise to V- and H-centres respectively.

Color centres produced by irradiation with x-rays

When a X-ray quantum passes through an ionic crystal, it will usually give rise to a fast photo-electron with an energy of the same order as that of the incident quantum. Such electrons, because of their small mass, do not have sufficient momentum to displace ions and therefore loose their energy in producing free electrons, holes, excitons and phonons. Evidently these while moving near the vacancies form trapped electrons as well as trapped holes.

The trapped-electron or trapped-hole centres so formed can be destroyed (bleached) by illuminating the crystal with light of the appropriate wavelength or warming it.


Thermoluminescence
Important information about the colour centres can be obtained by measuring the changes that occur when a coloured crystal is gradually heated. As the temperature is raised electrons and holes escape from their traps at an increasing rate. The freed charges can recombine with each other or with other defects and give out luminescence by recombination. The resulting thermoluminescence or ‘glow’ reaches maximum and then decreases to zero as the supply of trapped electrons or holes becomes exhausted. The plot of luminescence intensity verses temperature, taken at a constant heating rate, is called the ‘glow curve’. It may contain one or many glow peaks, depending upon whether there are one or several different kinds of traps.

From the glow curve one determine the trap depth; the deeper the trap, the higher the temperature of the glow peak. A correlation between the temperature at which thermoluminescence occurs and the temperature at which particular band bleach can give valuable information about specific centres.

Typical results obtained from this set-up for KCl crystal are shown in figure.


The experiment consists of the following


Experimental Set-Up for creating Thermolumnescece

  • Sample: KBr or KCl single crystal
  • Thermolumniscence Temperature Meter, TL-02
    * Digital Thermometer with RTD sensor
    * Oven Power Supply
  • Sample Holder
  • Thermolumniscence Oven (upto 423K)
  • Black Box

For Measurement of Luminescence Intensity

  • Photomultiplier tube: 931A
  • PMT Housing with biasing circuit and coaxial cables etc.
  • High Voltage Power Supply, Model: EHT-11
  • Nanoammeter, Model: DNM-121

Complete in all respect, only X-ray facilities are required to create F-centers in the crystal.

Photomultiplier Tube
Specifications of Photomultiplier tube 931A

Spectral Response

 
- Range 300 to 650(nm) 
- Peak wave length 400nm
Photo Cathode Material Sb-Cs
Dynode Structure/No. of Stages CC/9
Maximum Cathode Voltage 1250Vdc
Maximum Average Anode Current 0.1mA

Cathode Sensitivity


- Minimum 20µA/lm
- Typical 40µA/lm

Anode Sensitivity


- Minimum 50A/lm
- Typical 400A/lm
Anode to Cathode Supply Voltage 1000Vdc
Current Amplification 1.0x10 7
Anode Dark Current (after 30min)  
- Typical 10vA

- Maximum

50vA

PMT Housing
The housing is designed to provide a shielding from stray light and magnetic field. The slit arrangement at the window is provide to adjust the size of the window according to the incident beam and for the safety of photomultiplier tube when not in use. For E.H.T. input and current output, amphenol connectors are provided. A general purpose biasing circuit, using low noise, metal film resistors, is mounted on the base. The housing can be mounted in any position.

The biasing circuit can be changed to customer’s specification. Minor modification in design of PMT Housing is also possible.


* Products not listed can be ordered as per request.
* Model number may subject to change without intimation